A Working Lands for Wildlife tool
Invasion Severity Index
Plan, prioritize, and monitor invasive annual grass treatments across the sagebrush biome.
Why it matters
“Cheating” The West Of Its Future
#0
Threat to the sagebrush biome
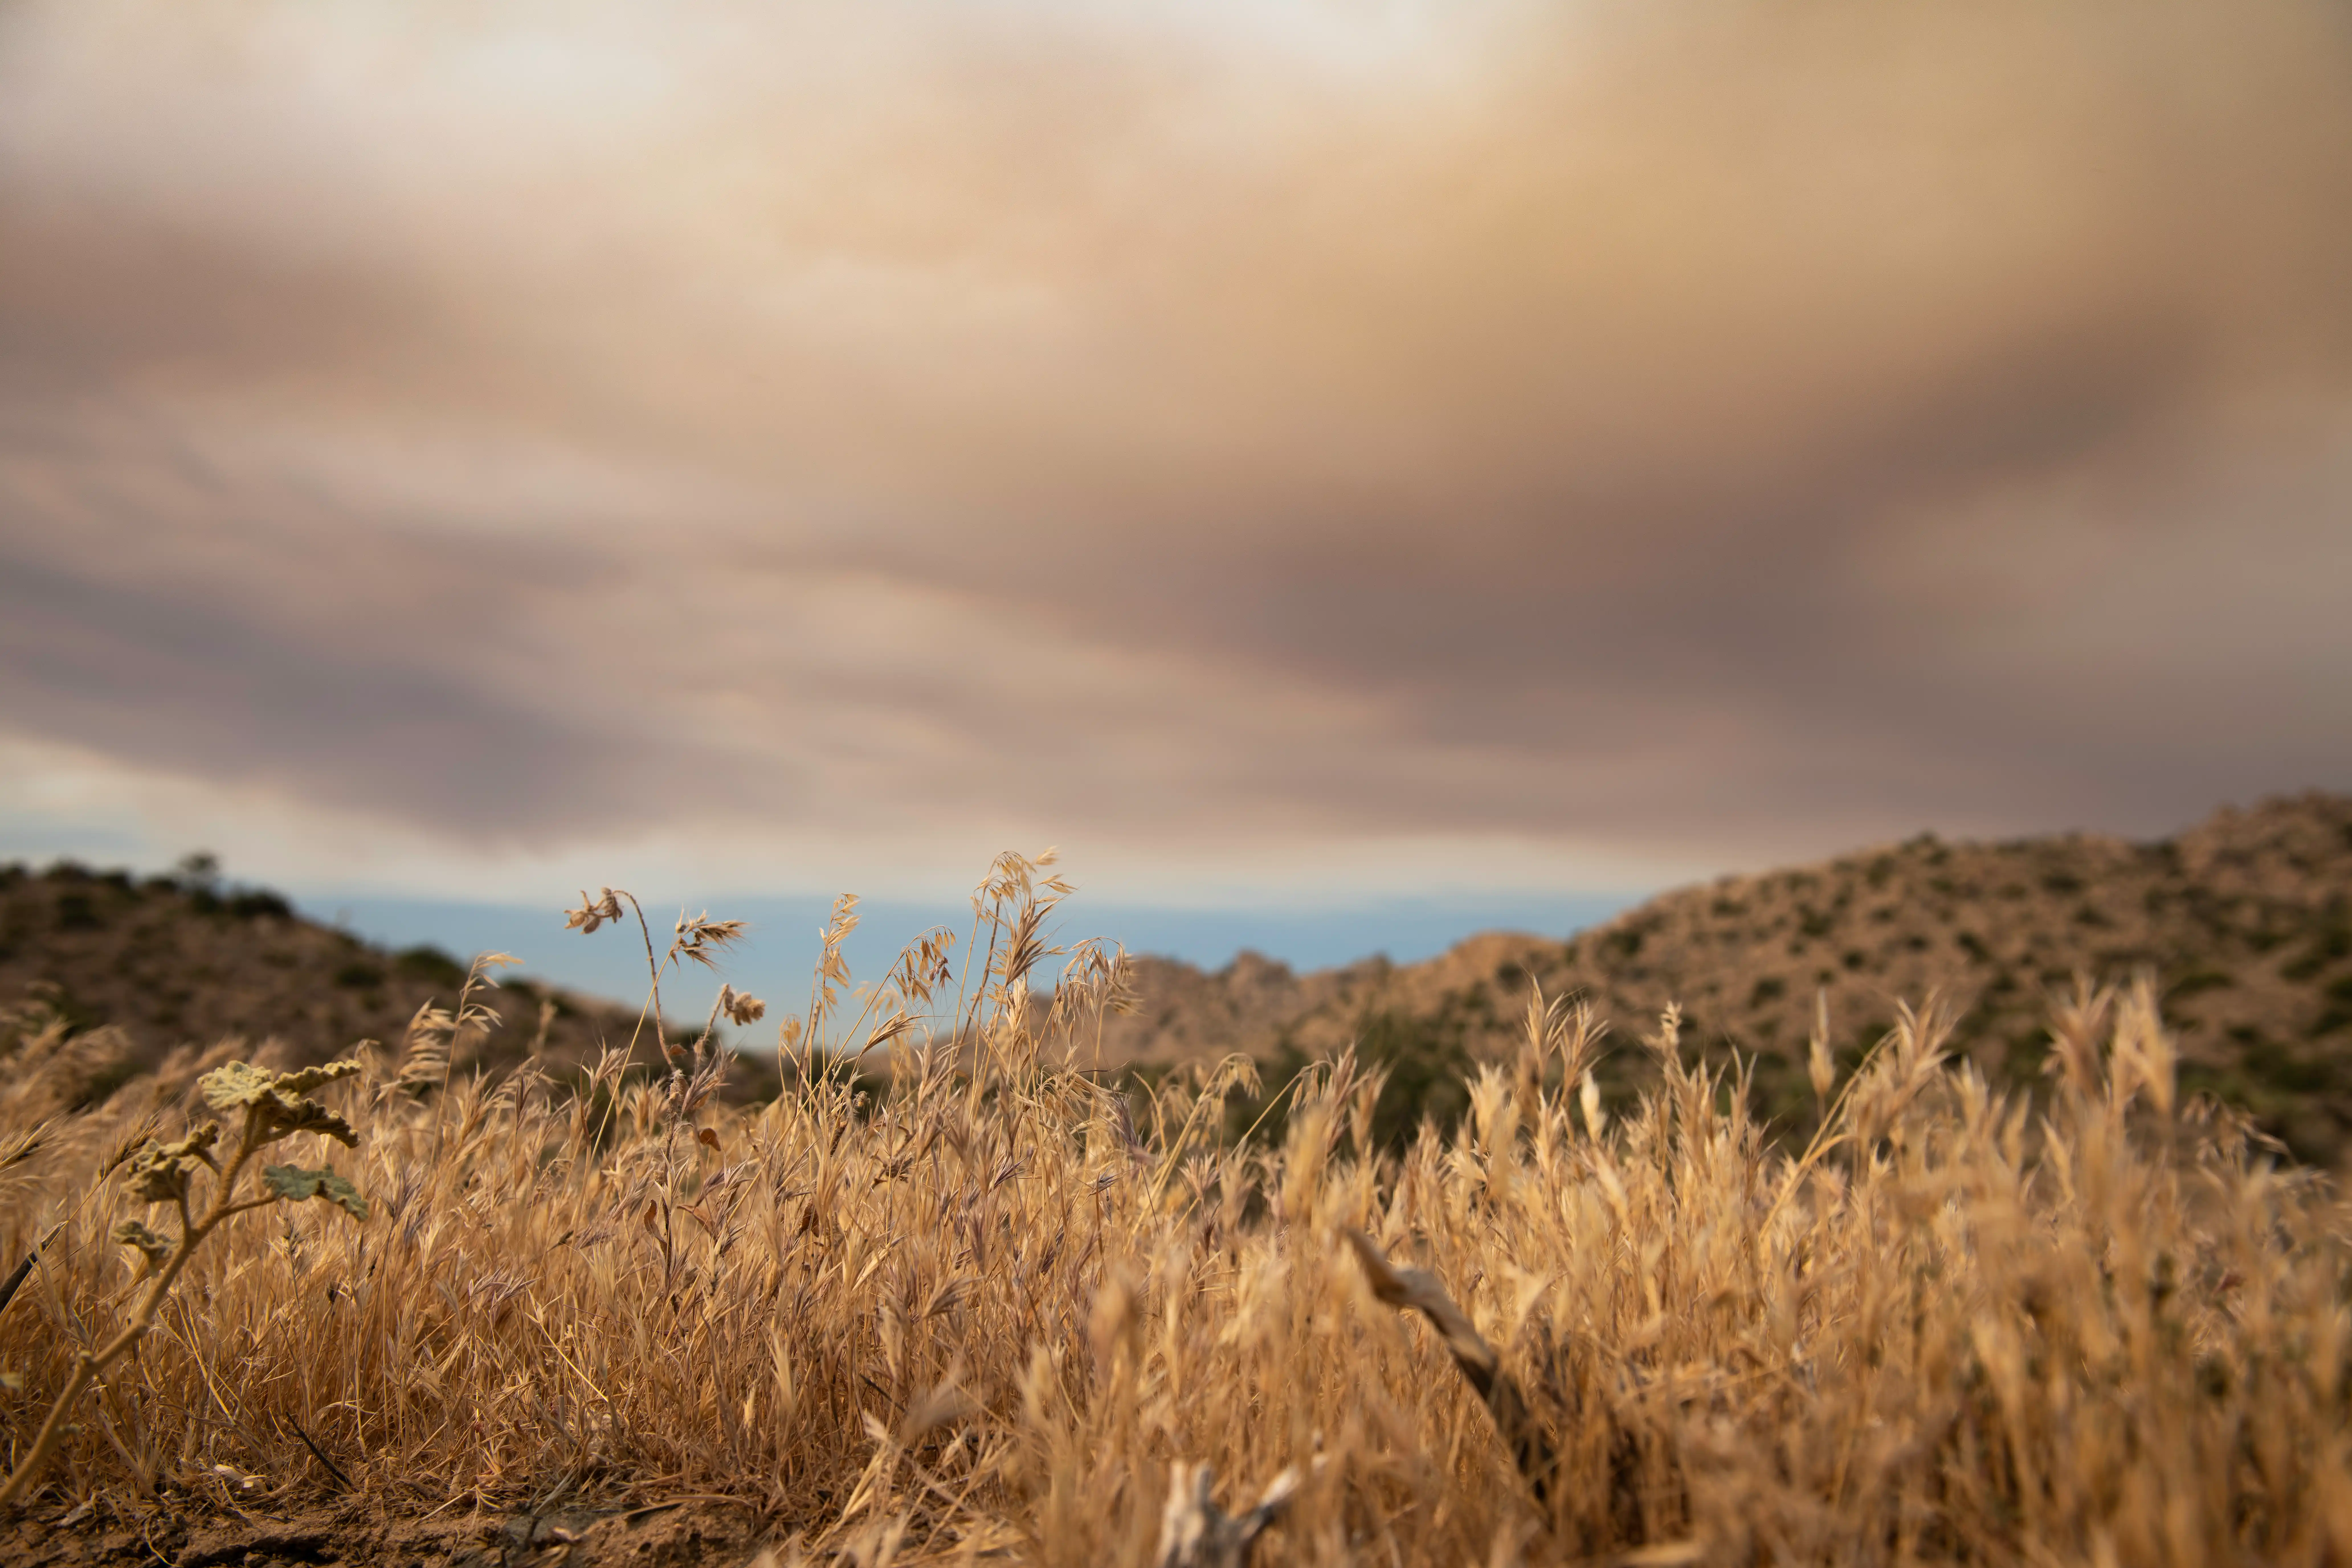
Invasive annual grasses are the top threat to core sagebrush areas.
0×
Risk of wildfire
Having invasive annual grasses on the landscape doubles the risk of wildfire occurrence.
0%
Loss of forage
Converting from perennial sagebrush rangelands to annual grasslands can reduce forage production by up to 70%.
A spatial tool for planning and monitoring treatments
Introducing The Invasion Severity Index
Effective management of invasive annual grasses requires not only understanding the distribution and extent of the invasion, but also what desired plants will fill the void once invasives are removed.
The ISI was created to help conservationists on the front lines of treatment planning gauge the extent of annual grass invasion relative to site recovery potential, while accounting for variations in productivity across the sagebrush biome.
Built for treatment scale
The ISI complements broader-scale prioritization and planning tools with the data field conservationists and land managers need to design and monitor land treatments. With this tool, users can:
Plan
Create a rapid baseline inventory of herbaceous conditions to inform treatment prioritization, delineation, and prescriptions — as a starting point to verify in the field.
Communicate
Better communicate with landowners, land managers, and stakeholders about conditions, goals, alternative treatments, and management expectations.
Monitor
Remotely monitor treatments to assess efficacy and the need for follow-up management.
ISI under the hood
From Satellite To Severity Map
IAG
0%

PFG
0%

BGR
0%
Other cover
0%
1Satellite imagery
Landsat satellites have imaged the sagebrush biome for four decades. The Rangeland Analysis Platform (RAP) turns that archive into vegetation cover estimates for every 10 × 10-m pixel — about half a tennis court of ground.
2Vegetation cover
Each pixel's cover is split into the three components that matter for invasion: invasive annual grasses (IAG), the desired perennial forbs and grasses (PFG), and bare ground (BGR) — rock, soil, and litter.
3Calculate the index
The ISI is the log ratio of invasives to perennials and bare ground — a single, continuous measure of how far invasion has progressed relative to what the site can recover to. Higher values mean greater severity.
4Severity map
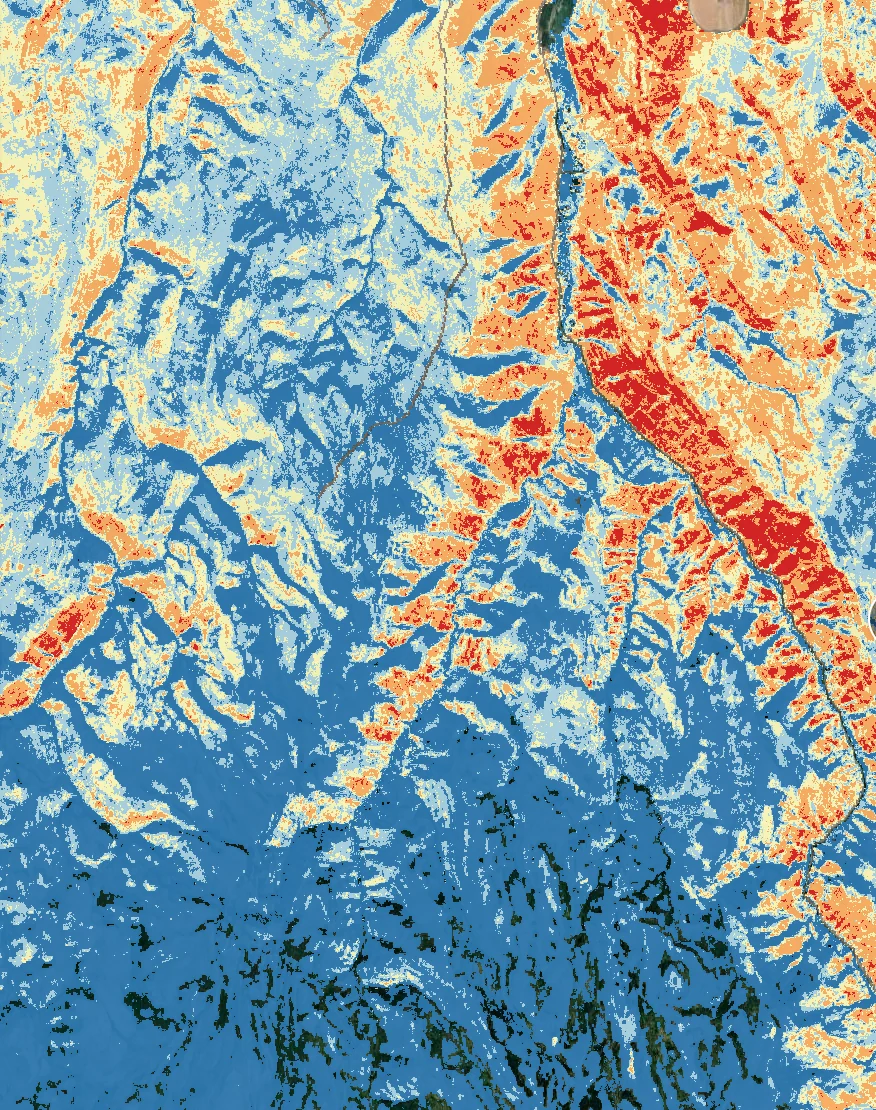
Scored for every pixel, every year from 2018 to present, severity becomes a map — five management-linked levels from Very Low to Severe, ready for treatment planning and monitoring.
Five levels, five ways to act ↓ε is a small constant that keeps the ratio defined when cover values approach zero. Higher ISI values indicate greater invasion severity.
Satellite imagery
Landsat satellites have imaged the sagebrush biome for four decades. The Rangeland Analysis Platform (RAP) turns that archive into vegetation cover estimates for every 10 × 10-m pixel — about half a tennis court of ground.
Vegetation cover
Each pixel's cover is split into the three components that matter for invasion: invasive annual grasses (IAG), the desired perennial forbs and grasses (PFG), and bare ground (BGR) — rock, soil, and litter.
Calculate the index
The ISI is the log ratio of invasives to perennials and bare ground — a single, continuous measure of how far invasion has progressed relative to what the site can recover to. Higher values mean greater severity.
Severity map
Scored for every pixel, every year from 2018 to present, severity becomes a map — five management-linked levels from Very Low to Severe, ready for treatment planning and monitoring.
Five levels, five ways to act ↓Linking severity to management
Five Levels, Five Ways To Act
* ISI = ln( (IAG + ε) ⁄ (PFG + BGR + ε) )
Breakdown of five Invasion Severity Index (ISI) levels with associated management strategies, descriptions and mathematical range of each. Strategies are suggestions and may differ based on conditions, values, and resources available.
Platform outputs
What You Can See And Analyze
Invasion severity maps
See severity anywhere in the sagebrush biome.
Continuous 10-m ISI for any single year from 2018 to 2025, or a smoothed 2023–2025 average.
Cover components
Look behind every ISI value.
The three RAP indicators the index is built from — invasive annual grass, perennial forb and grass, and bare ground cover.
Severity levels
Turn a continuous metric into a decision.
Five management-linked classes, from Very Low to Severe, each tied to a typical strategy and set of actions.
Treatment-scale summaries
Get numbers for the ground you manage.
Query a single pixel, or delineate an area by hand or by upload, and summarize ISI and cover across the 2018–2025 record.
Management context layers
Place severity in the context that drives decisions.
Threat-Based Ecostates, Sagebrush Conservation Design tiers, the IAG Management Framework, and land ownership boundaries.
Fire history
See which pixels burned, and when.
MTBS fire perimeters from 2000 to 2024, overlaid on severity so you can read invasion against recent fire.
A spatial tool for planning and monitoring treatments
See the invasion. Plan the recovery.
Turning data into action
Prioritize, Plan, And Monitor Treatments
Map the invasion
Visualize 10-m resolution ISI data anywhere in the sagebrush biome, for any year from 2018 to present.
- Single years 2018–2025, or a 2023–2025 average
- Adjustable layer opacity over satellite, street, topo, or dark basemaps
- Masking that removes non-vegetated, cultivated, and ≥50% tree cover
Area-of-interest summaries
Click a point or draw an area to summarize invasion severity and RAP cover across your treatment unit.
- Query a single pixel, or delineate a polygon by hand or by upload
- ISI and RAP cover trends across the full 2018–2025 record
- Download data for use in your own GIS platform
Customize your view
Layer in the management context that matters for your decision, then filter down to the pixels you care about.
- Threat-Based Ecostates, Sagebrush Conservation Design, IAG Management Framework
- Land ownership boundaries
- MTBS fire perimeters, 2000–2024, to see which pixels burned and when
Brought to you by
Built By And For The Conservation Community


Project partners


Data partner: ISI is derived from Rangeland Analysis Platform 10-m cover indicators.
Let’s talk
Put Invasion Severity Data To Work On Your Landscape
Explore and analyze annual grass invasion and recovery potential at a treatment scale, or get in touch with the team behind the tool.
technology@wlfw.org —